Build labs
Design mode
Build the physical topology - nodes, links, and inspector fields - before you Start in Operate.
GUI-guided tutorial for placing devices, connecting ports, and using the Node Inspector. Workspace chrome: Toolbars and More menu. Links: Link inspector and impairment.
Goal
Build the physical topology - nodes, links, and inspector fields - before you Start in Operate.
Why Design exists
Topology is the source of truth. Wrong links mean the wrong lab forever. Design is where you build before you burn CPU on Start.
For Cisco CSR1000v / C8000v, keep Gi1 as management and put lab data on Gi2+ - see CSR and multi-NIC interfaces.
GUI tutorial
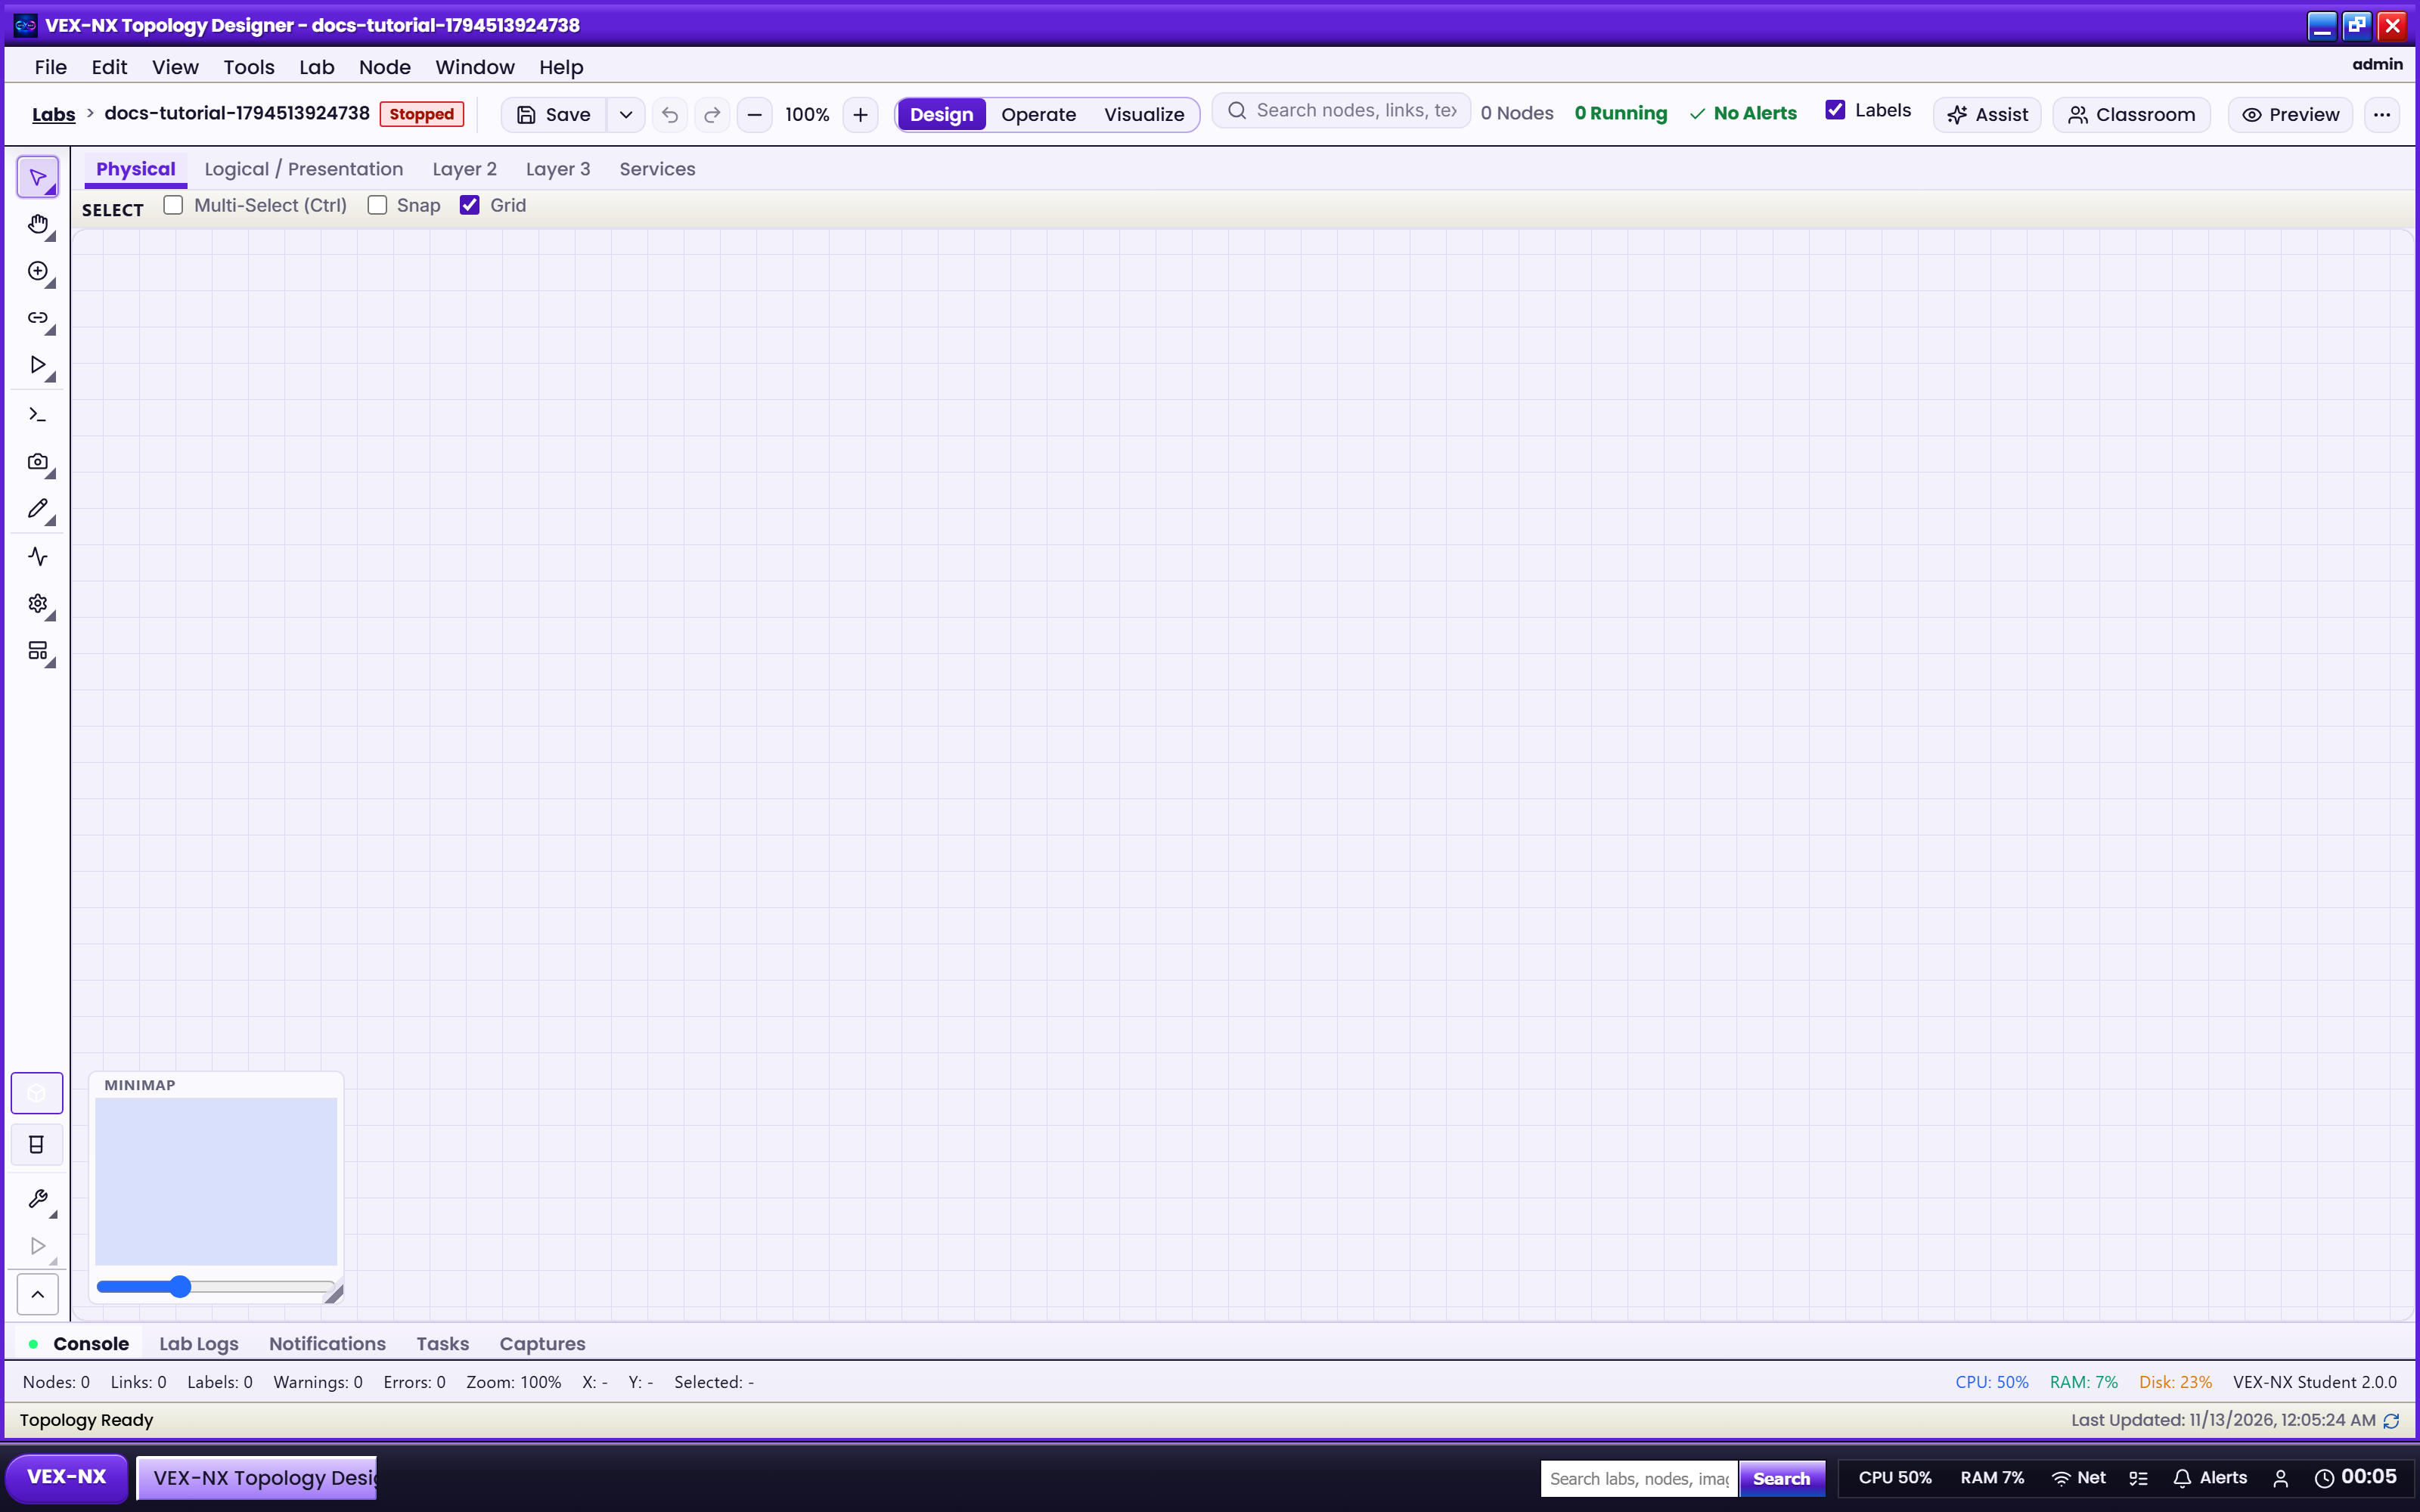
Step 1 - Open Design
- Open a lab
- Click Design on the workspace bar (Design | Operate | Visualize)
| What you see | Design tools and canvas |
| Expected | Mode button highlights Design |
Step 2 - Open the node palette
- Expand the palette / templates drawer if collapsed
- Filter or search for a template (FRR, Alpine, IOSv, ...)
- Keep the canvas visible - do not cover it with unrelated chrome
| What you see | Template list ready to place |
| Expected | You can pick a device type |
Step 3 - Place a device
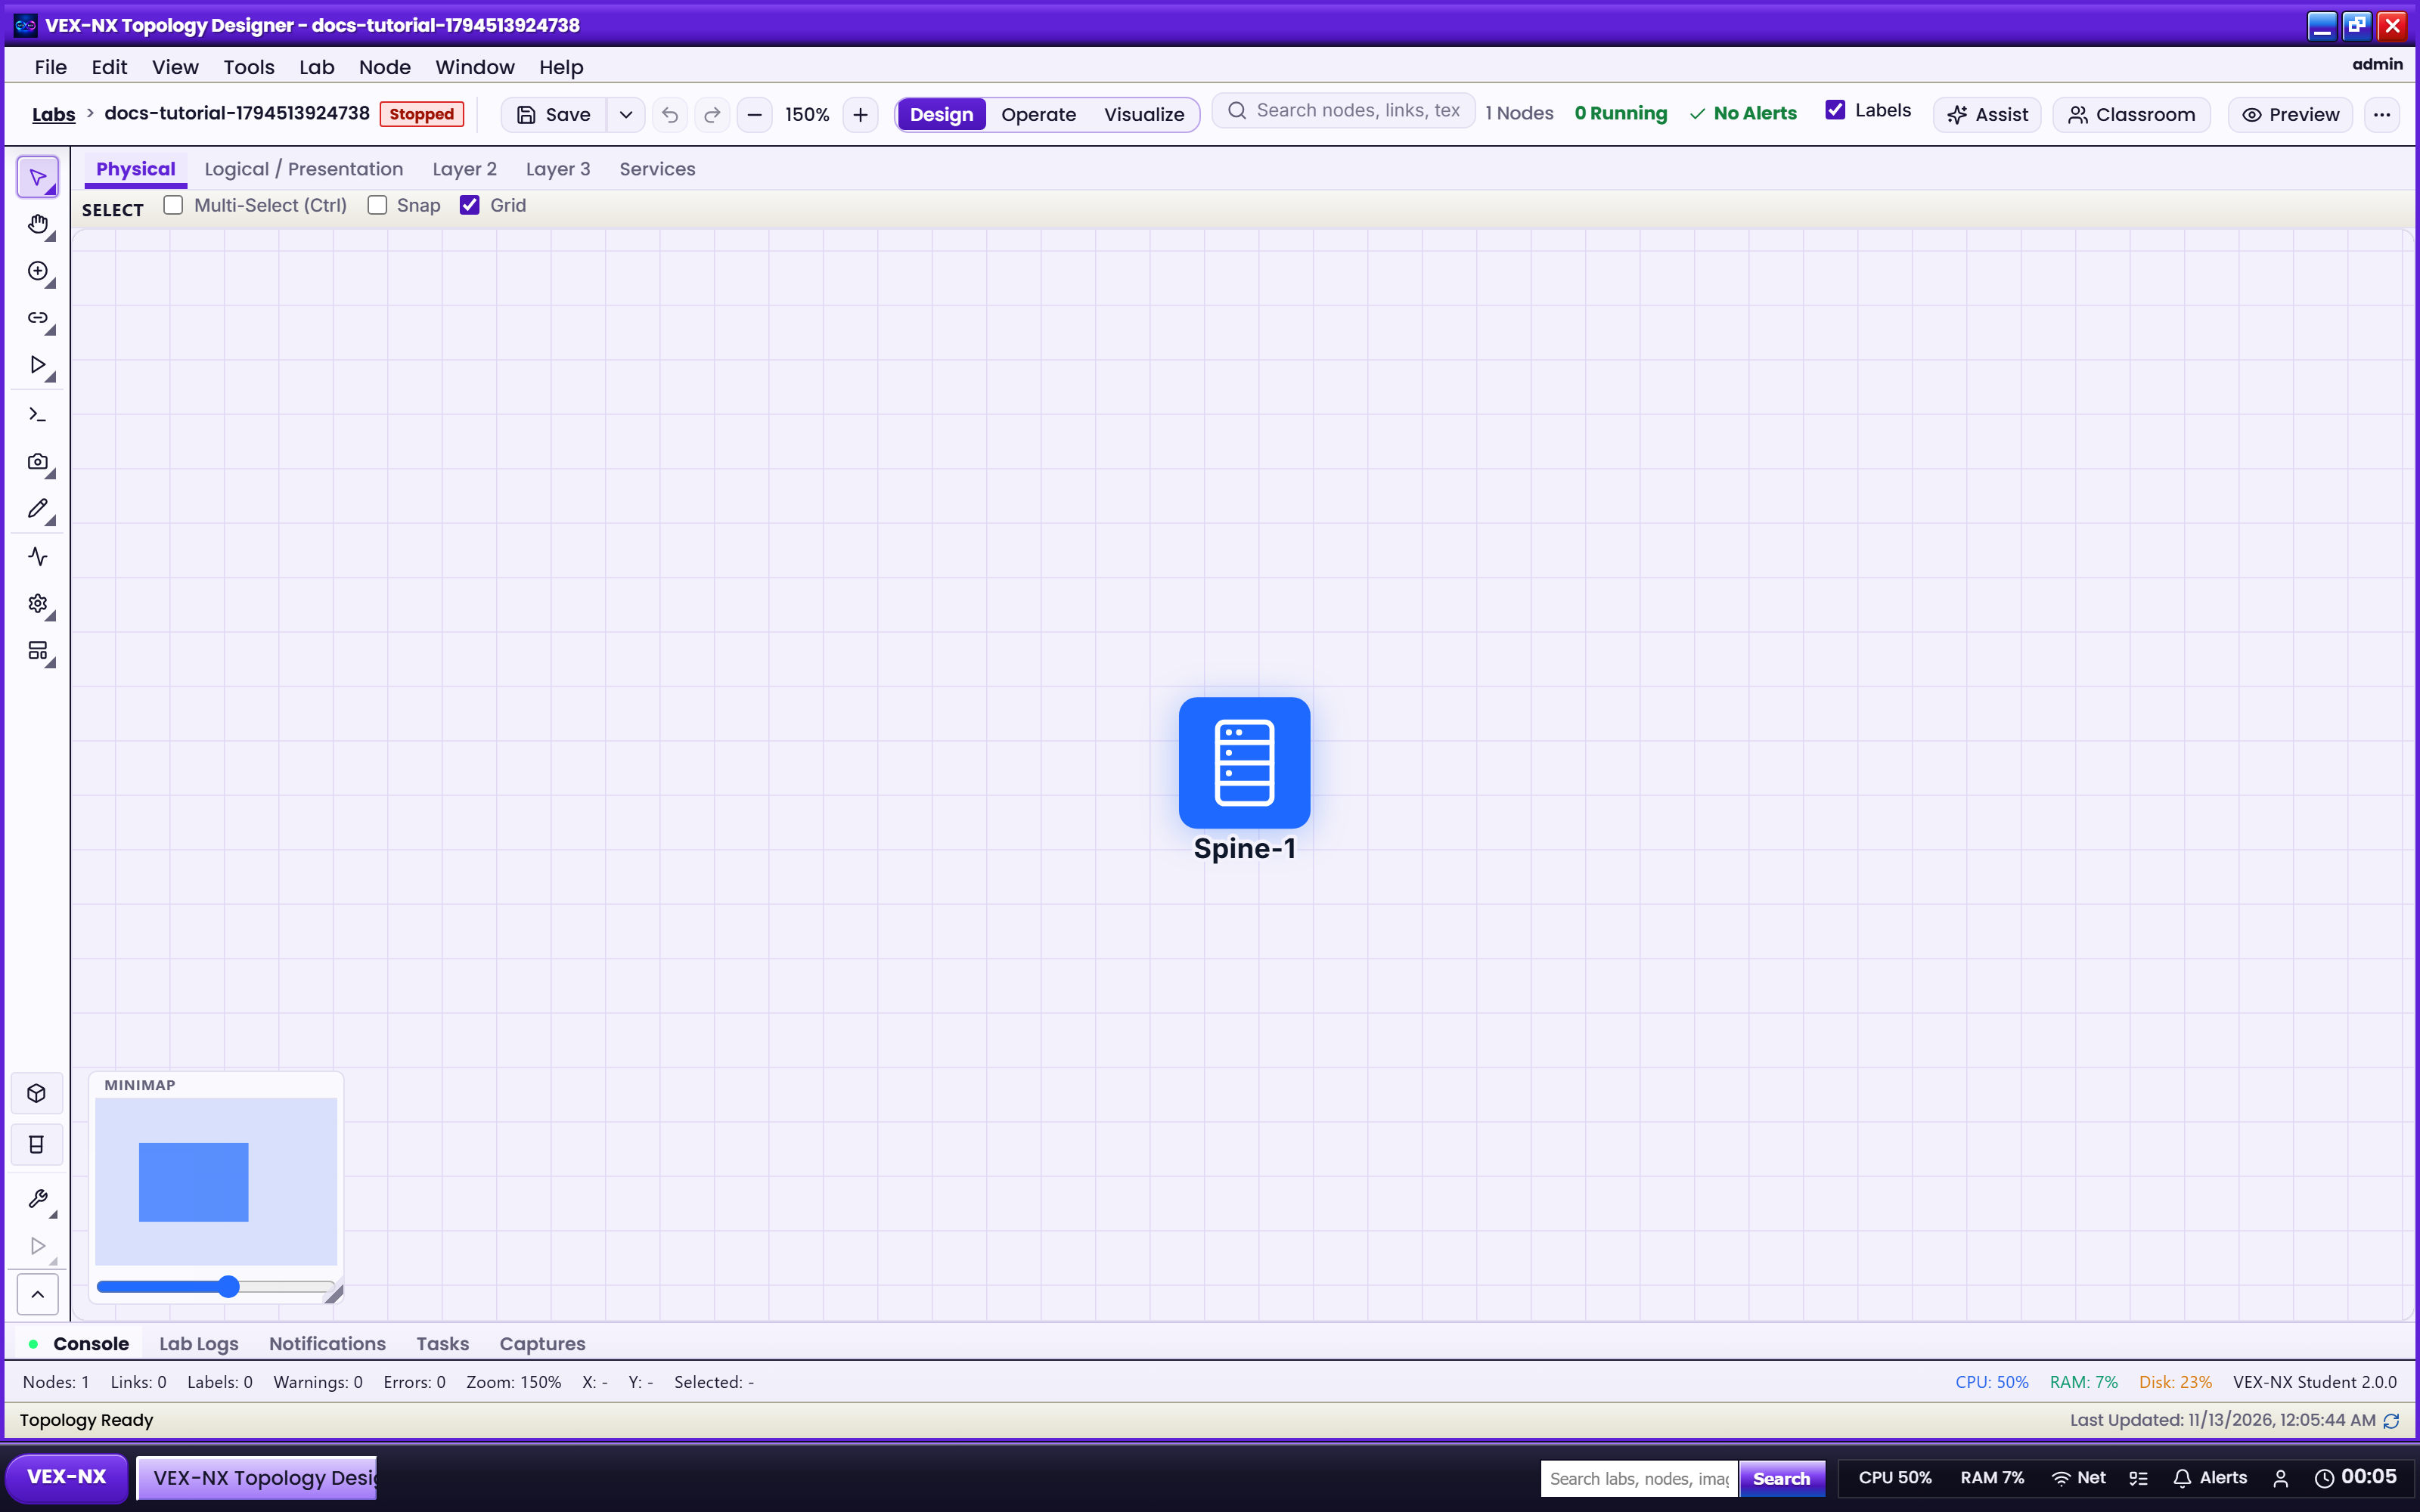
- Drag a template onto the canvas or click Add / place from the picker
- Double-click the label under the icon to rename
- Use More -> Device name size on a projector if names wrap
| What you see | Node icon on the canvas |
| Expected | Node appears in the lab model (Save if prompted) |
Step 4 - Connect ports
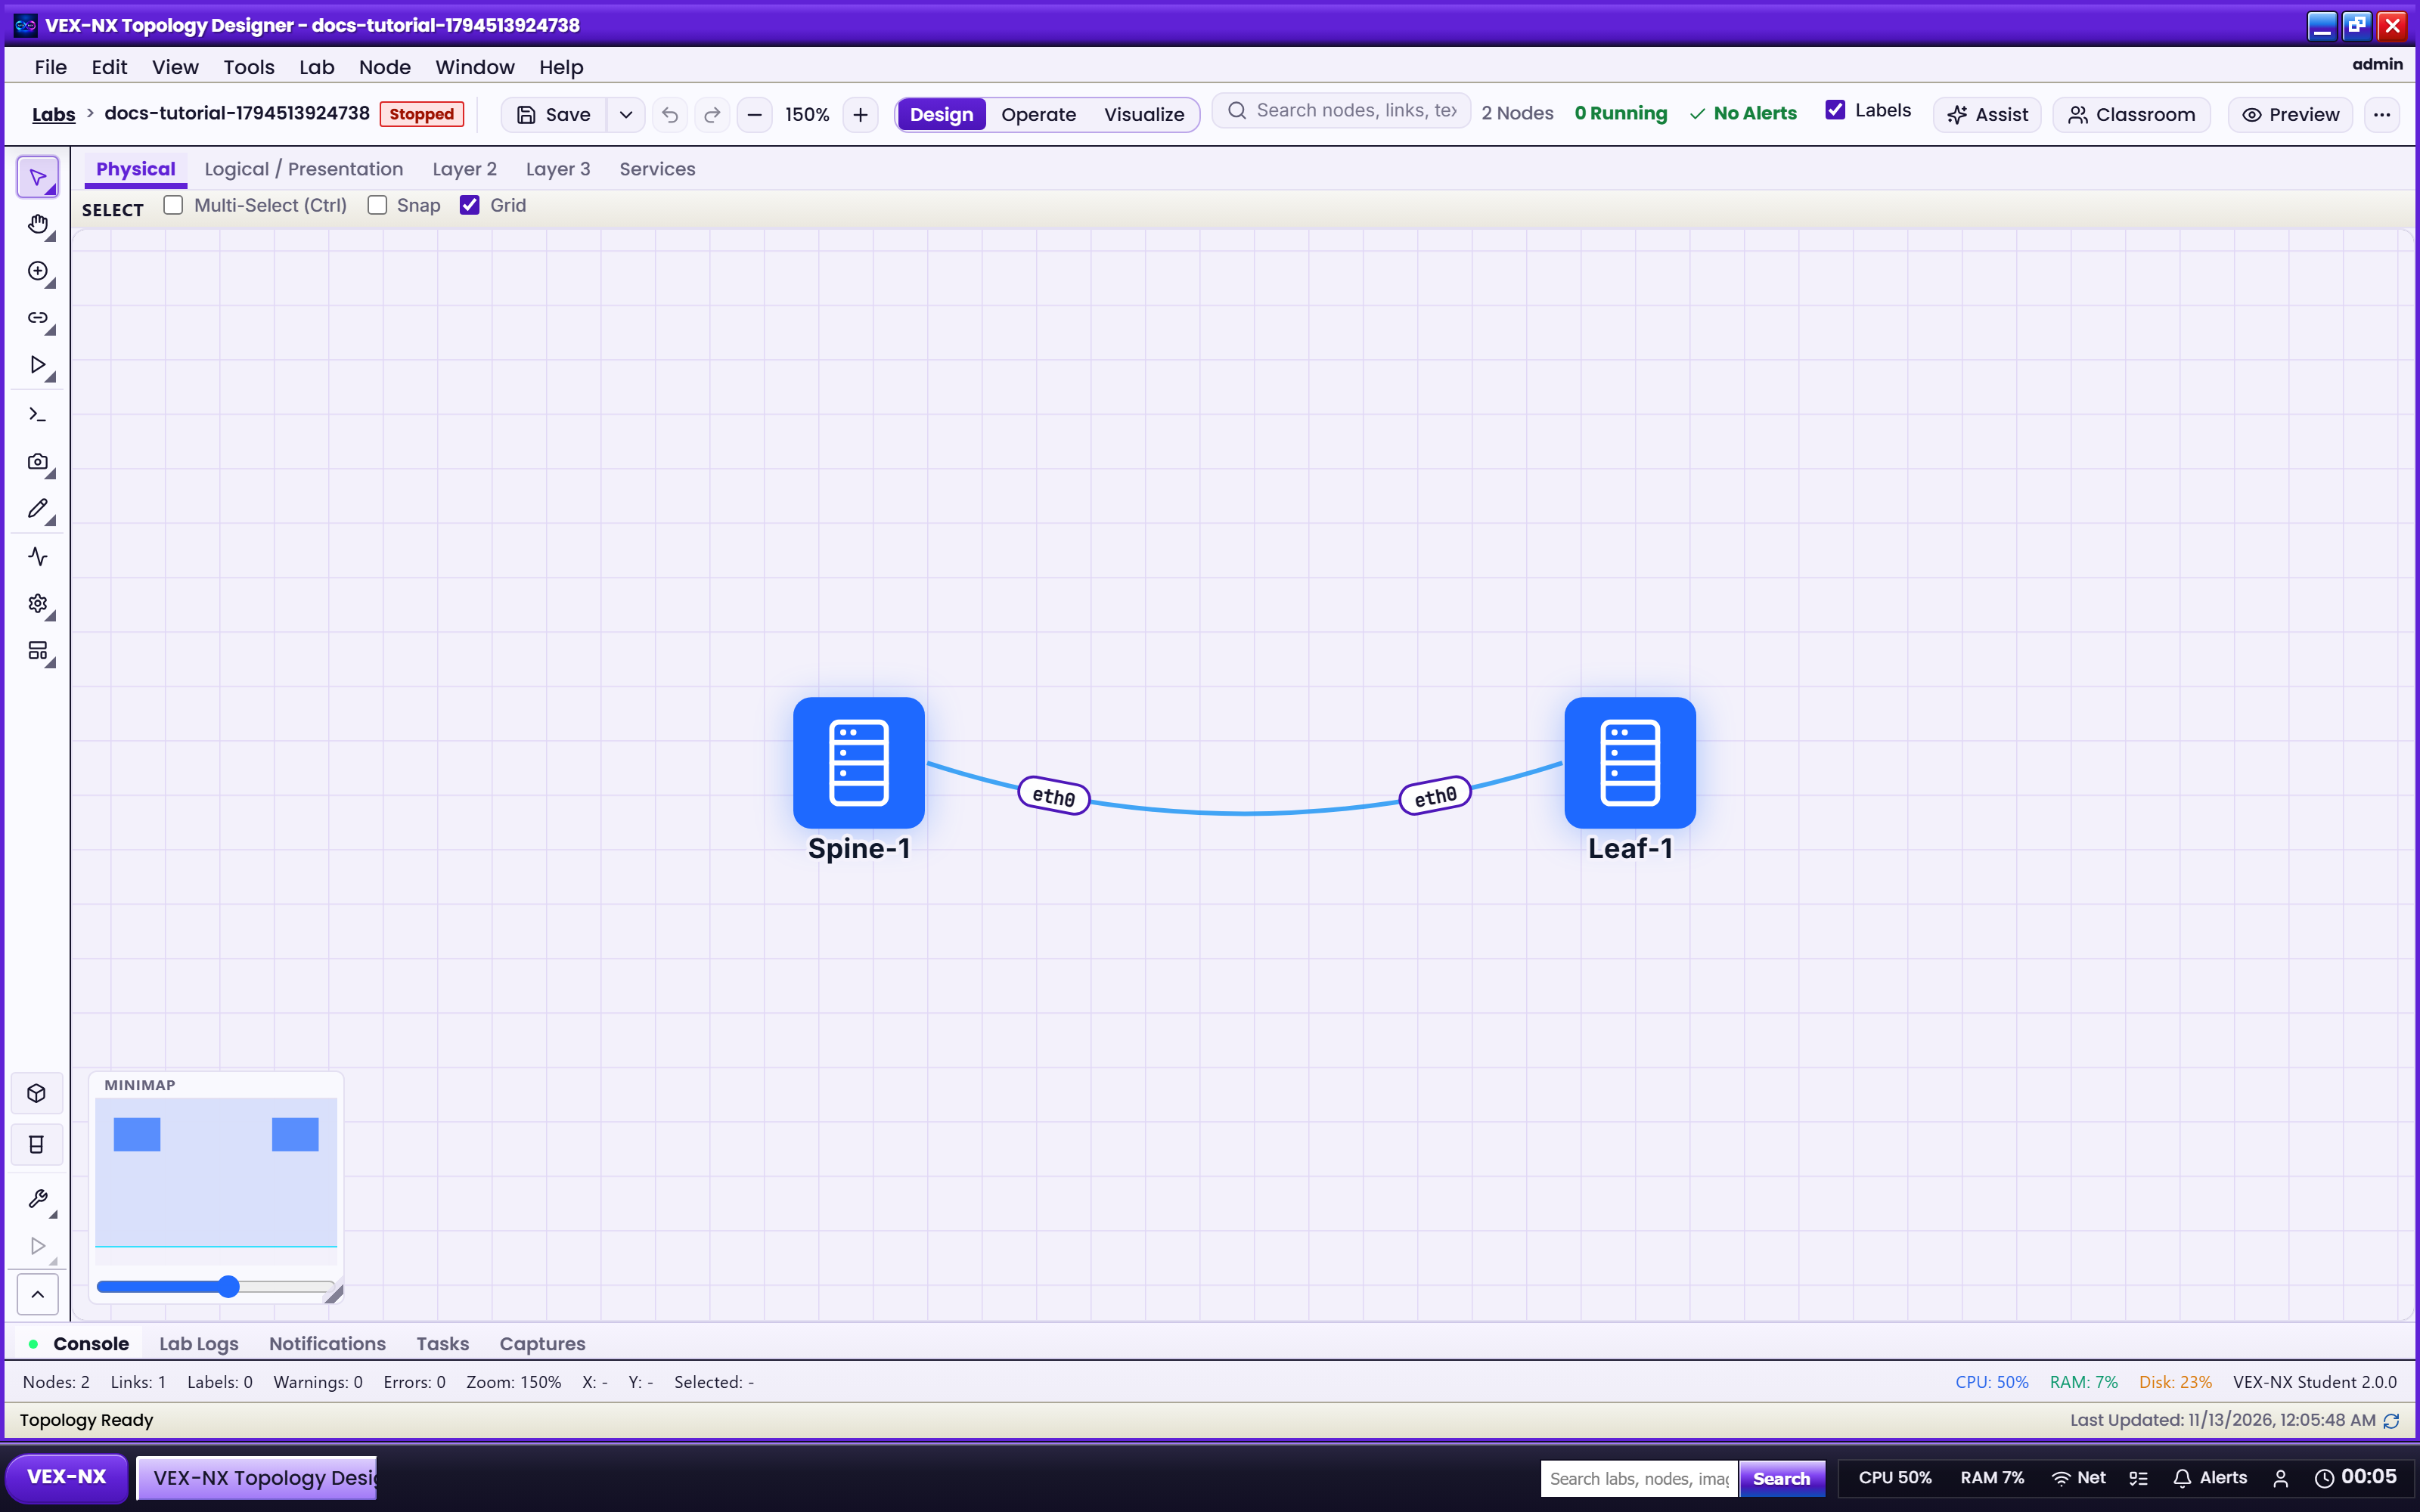
- Stay on Select (not Hand / pan)
- Hover a node -> drag from a port to another port or cloud
- Use Management / NAT / Bridge clouds for external reachability (Networks and clouds)
Example: Two Alpine or FRR nodes linked on data ports.
| What you see | Edge between nodes |
| Expected | Link exists; click it later for Link inspector |
Step 5 - Node Inspector
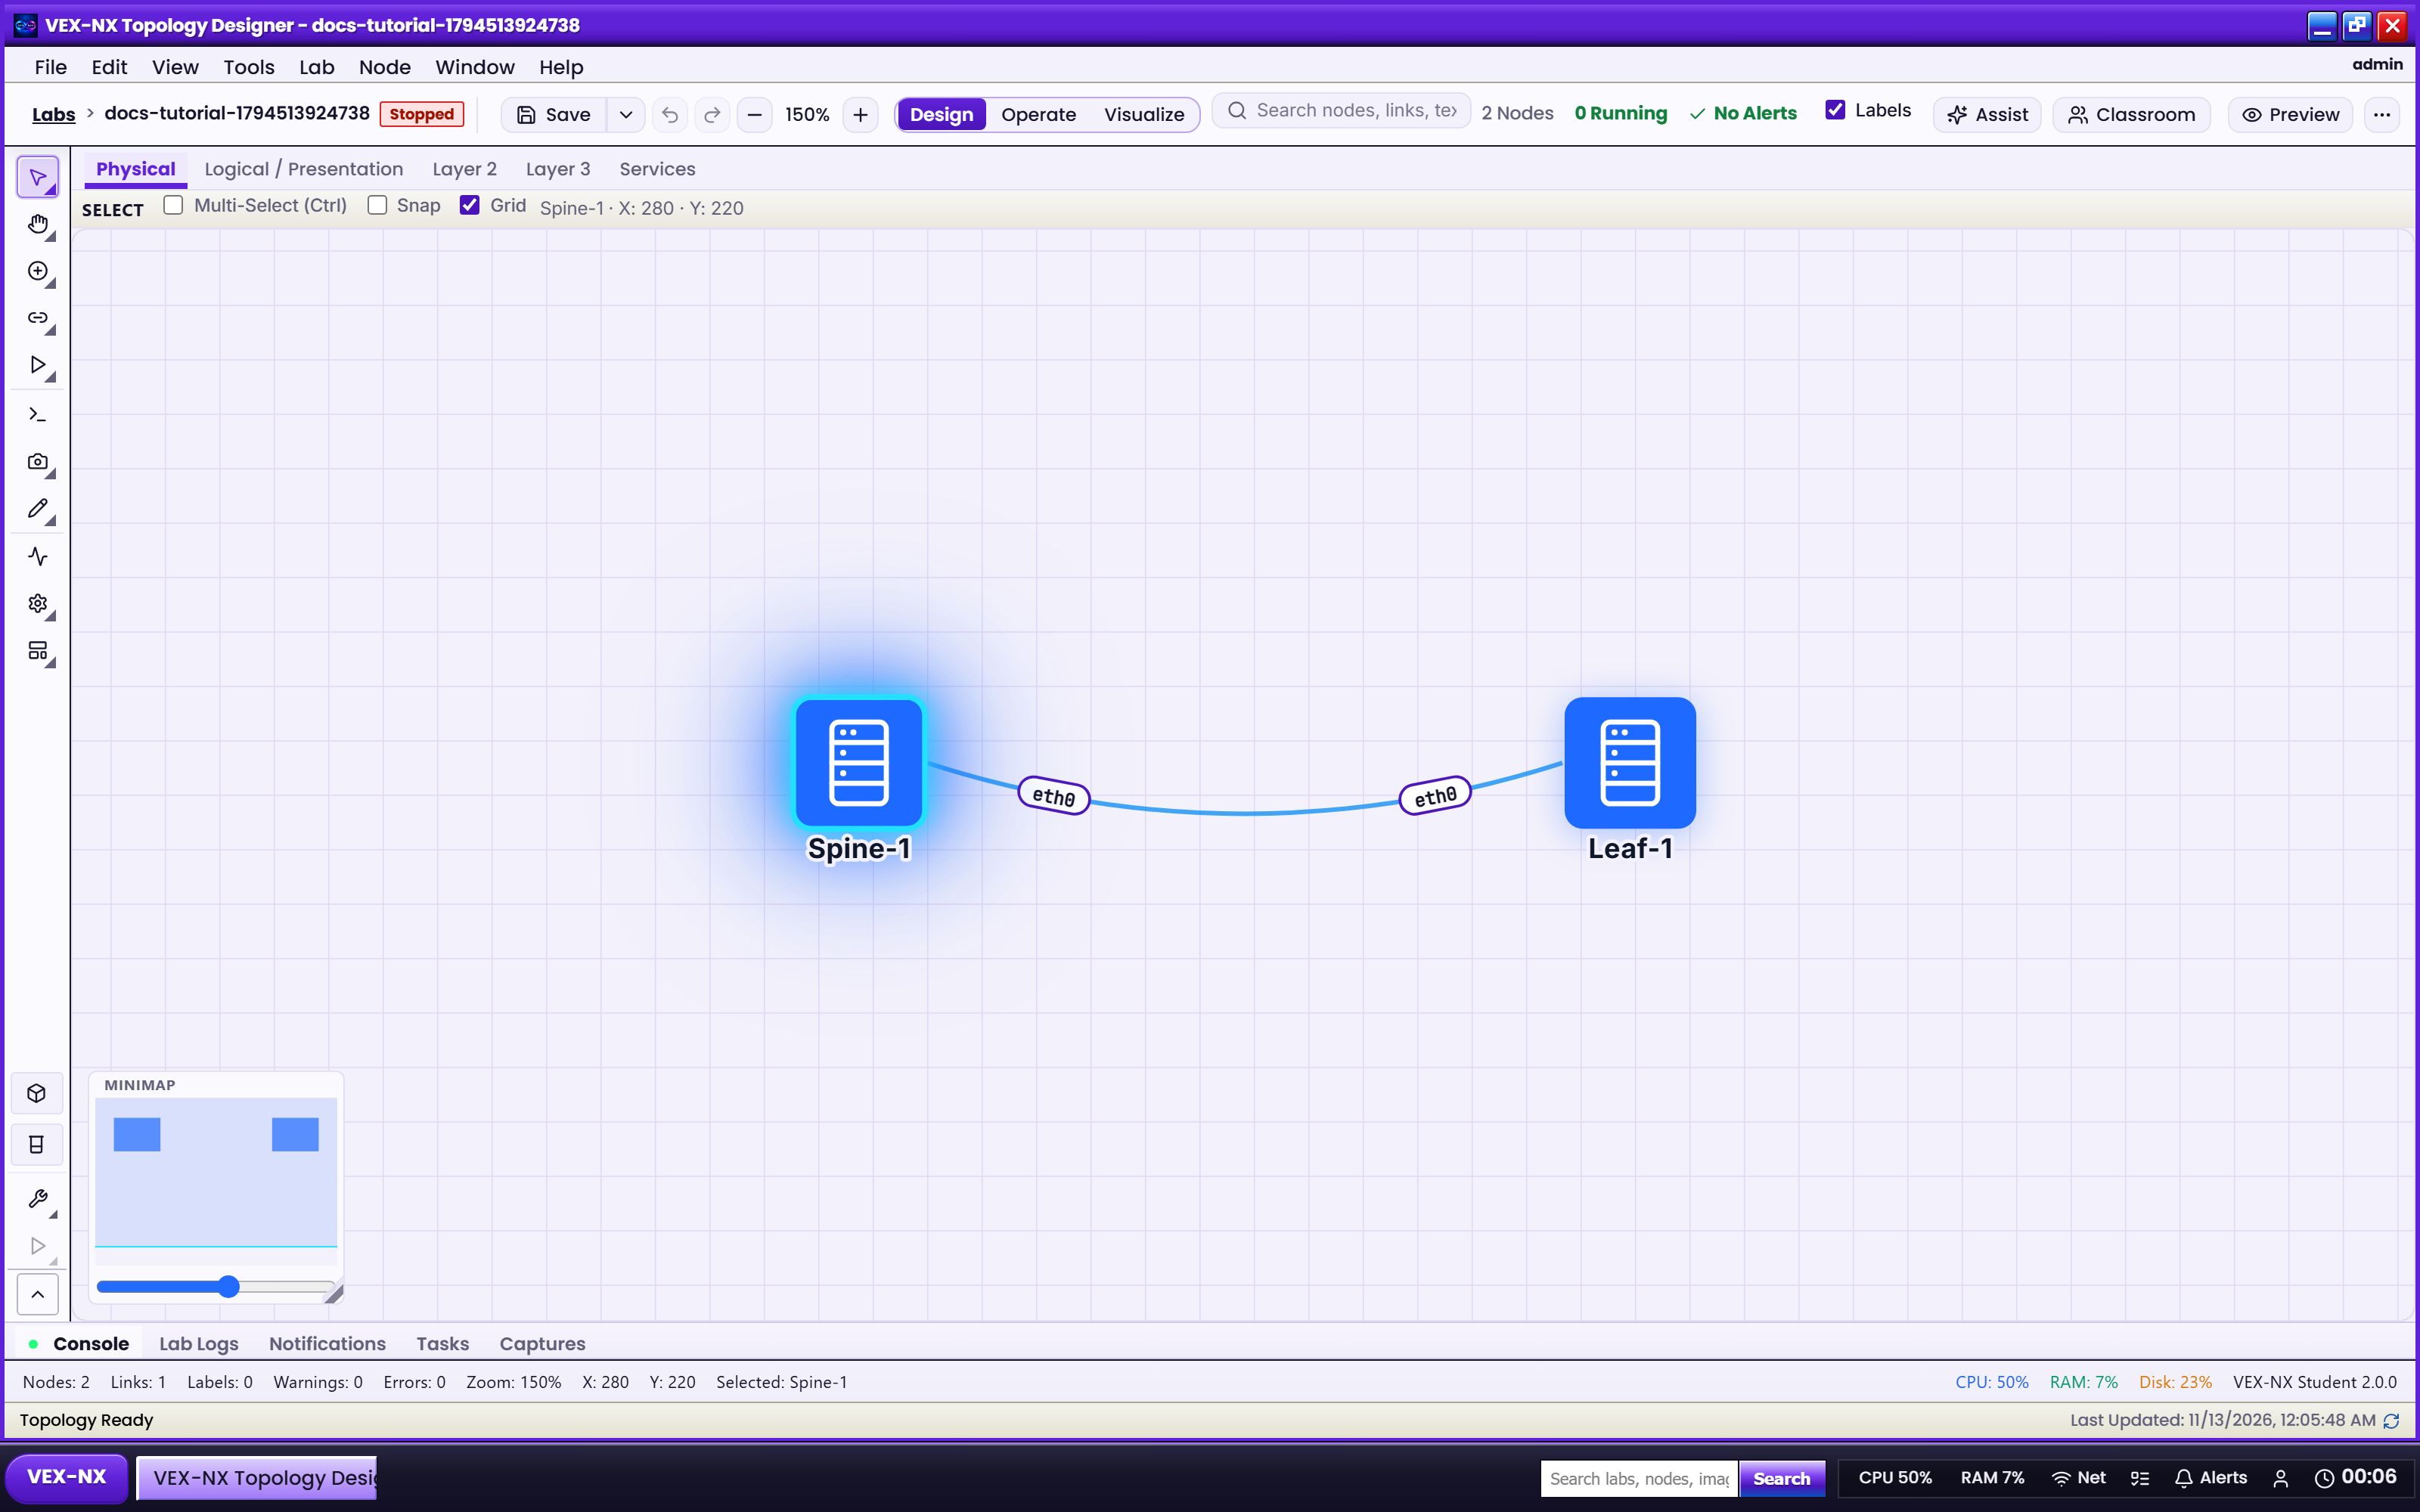
- Click a node
- Open inspector tabs: Overview, Interfaces, Config, Console, Files, Metrics (as offered)
- Confirm name, template, interfaces, and allocations match what you intended
| What you see | Selection-driven inspector |
| Expected | Fields come from the node model - not hard-coded demo text |
Step 6 - ScriptPad / Config tip
- Select a node -> ScriptPad or Config
- Activate the profile that should boot
- Apply on Wipe + Start in Operate - details in Operate and consoles
Step 7 - Hand off
- Ready to boot -> Operate and consoles
- Demo traffic -> Traffic Lens
- Edge quality -> Link inspector and impairment
Recipe: ScriptPad startup config (detail)
- Select a node -> open ScriptPad (or Config from the context menu)
- Choose or create a profile (
default,imported,assist, ...) - Mark the active profile - that text injects at boot on supported platforms
Why profiles matter: Wipe and Assist can write different versions. Active is what boots.
Recipe: zones and notes
Use Design tools for zones, text, and shapes when teaching. Keep labels readable; prefer interface labels via the Labels control on the workspace bar.
Expected result
- Palette, place, connect, and inspector all work without leaving Design
- Physical topology is ready for Operate Start
If it fails
- Cannot place -> open palette; check licence / template catalog (Images)
- Cannot link -> use Select tool; drag from port handles
- Inspector empty -> click the node body; wait for load
Related
- First lab walkthrough
- CSR and multi-NIC interfaces
- Link inspector and impairment
- Visual Feature Atlas - Design